Continuous Performance Analysis with Lighthouse and Jenkins
Together with WebPageTest and Google Page Speed Insights it is an indispensable tool to optimize your website performance.
Installation
Lighthouse can be installed in any JavaScript-based project by just running ‘npm install’:
$ npm install lighthouse -g
If you don’t have a package.json in your project, just install npm and run ‘npm init’ before installing.
Running Lighthouse
You can check the performance of any website by calling the ‘lighthouse’ command with the URL of the website you want to test. Append the --view parameter to show the HTML report, right after the command has finished:
$ lighthouse https://kitconcept.com --view
The report will give you five different ratings about PWA, performance, accessibility, performance best practices, and SEO.
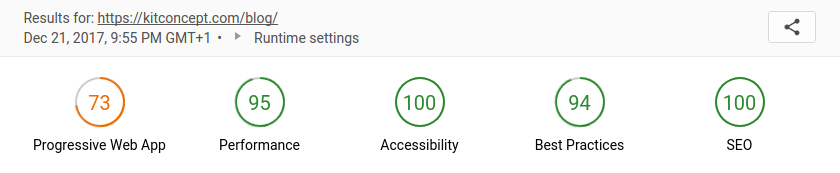
Lighthouse Results
Continuous Performance Measurements
If you run your performance test every now and then, you always risk to hurt your website performance without noticing. If a performance regression happens unnoticed, it is usually very hard and time consuming to figure out which change caused the performance regression.
You can easily fix this and save lots of time when you run your performance tests and analysis continuously.
Unfortunately Lighthouse does not allow you to set performance test specifications that your CI system can test against, like WebPageTest or Google Page Speed Insights do (we will cover those tools in later blog posts). Though, it is still very convenient to run the performance test on a regular basis for each commit and include them into your CI report.
Install Lighthouse locally for CI
When it comes to Continuous Integration, a local installation is preferred over a global one, which is usually harder to manage and maintain. Especially if you have multiple projects with different sets of package versions on your CI.
Therefore we install Lighthouse locally in our project directory:
$ npm install lighthouse --save-dev
This command will install Lighthouse to your local package.json file. We recommend to use yarn or npm package-lock.json to lock down the package version you are using for a repeatable and stable project build.
For convenience, we add a “lighthouse” script to our package.json:
"scripts": {
  "lighthouse:ci": "node_modules/lighthouse/lighthouse-
  cli/index.js \
  --output-path=./lighthouse-report.html --quiet \
  --chrome-flags='--headless' https://kitconcept.com"
}
We call the locally installed lighthouse binary and set a static output path (by default, Lighthouse creates a file with the current date/time in the filename which makes it harder to publish on your CI).
We also include the --quiet option and run it on headless chrome, so we don’t need to install and run an X server on our CI system.
At the end, we hard-code our project URL into the command so we do not have to type it manually each time we run this command.
Now we can just run:
$ npm run lighthouse:ci
and it will create a nice HTML report that we can publish in our CI.
Configure Lighthouse for your local development environment
For convenience, we also add a command that you can run locally:
"scripts": {
  "lighthouse": "node_modules/lighthouse/lighthouse-
  cli/index.js \
  --output-path=./lighthouse-report.html --quiet \
  --chrome-flags='--headless'
  https://kitconcept.com/blog"
}
The --view parameter will fire up a browser with the report at the end of the performance analysis. This is something we clearly don’t want on our CI system.
Publish Lighthouse Reports in Jenkins CI
Travis and other lightweight CI system usually lack the option to publish any reports except the command line output. Though, if you are using Jenkins CI, you can use the HTML publisher plugin to publish your Lighthouse report.
sh 'npm install'
sh 'npm run lighthouse'
publishHTML (target: [
  allowMissing: false,
  alwaysLinkToLastBuild: false,
  keepAll: true,
  reportDir: '.',
  reportFiles: 'lighthouse-report.html',
  reportName: "Lighthouse"
])
After adding publishHTML to your Jenkins pipeline, you will see a “Lighthouse” link under the ‘Artifacts’ tab:
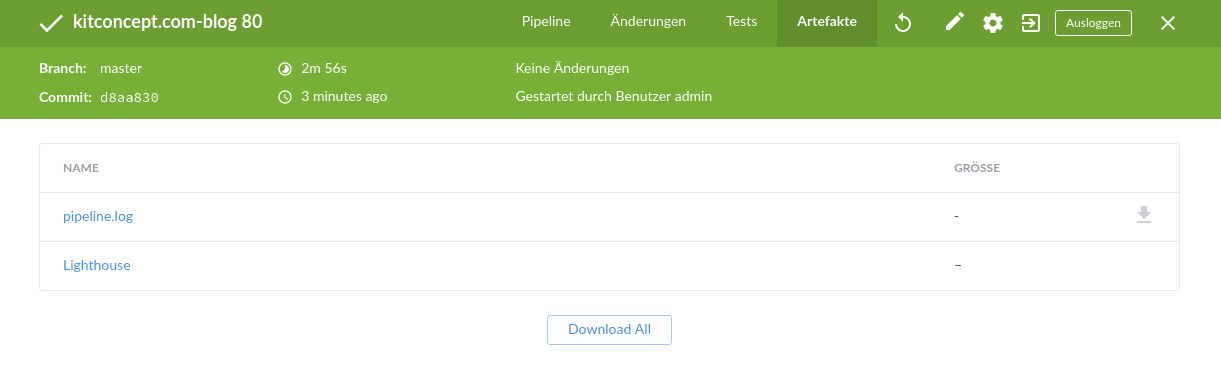
Link to Lighthouse report in Jenkins
There is a caveat though. Jenkins 1.641 / 1652.3 introduce the Content-Security-Policy header to static files served by Jenkins. The default header is set to a very restrictive set of permissions to protect Jenkins users from malicious HTML/JS files in workspaces.
To allow Jenkins to display the Lighthouse reports, we have to add the following JAVA_ARGS to the Jenkins startup (for instance by adding the following line to your /etc/default/jenkins file):
JAVA_ARGS="-Dhudson.model.DirectoryBrowserSupport.CSP=\"sandbox
allow-scripts; default-src 'unsafe-inline'; img-src * data:\""
For more details see the Content Security Policy Reference and the Jenkins docs on configuring Content Security Policy.
After you fixed the Content Security Policy of your Jenkins you will see the full report when clicking on the ‘Lighthouse’ link on the ‘Artifacts’ tab on your Jenkins build:
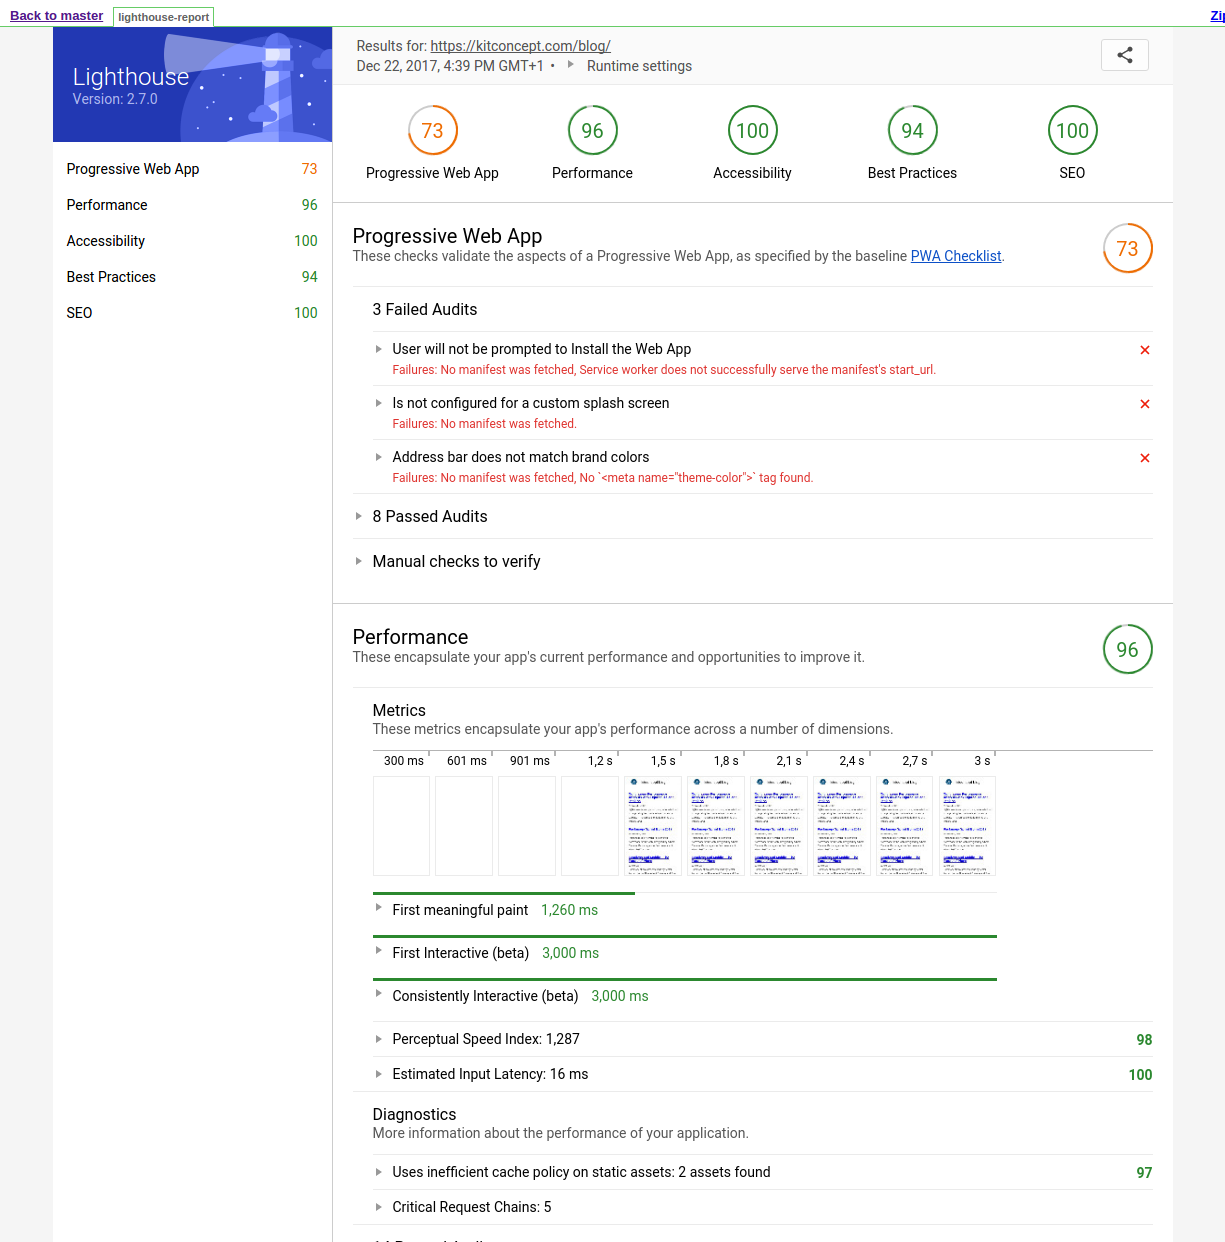
Lighthouse Report in Jenkins
Jenkins Declarative Pipeline Stage for Performance Tests
A full declarative pipeline stage for lighthouse looks like this:
stage('Performance Tests') {
  agent {
    label 'master'
  }
  when {
    branch 'master'
  }
  steps {
    deleteDir()
    checkout scm
    sh 'npm install'
    sh 'npm run lighthouse'
  }
  post {
    always {
      publishHTML (target: [
        allowMissing: false,
        alwaysLinkToLastBuild: false,
        keepAll: true,
        reportDir: '.',
        reportFiles: 'lighthouse-report.html',
        reportName: "Lighthouse"
      ])
    }
  }
}
We run the performance test stage on ‘master’ agents and only on the master branch. The steps performed are a simple “npm install” to set up the project build and then we run ‘npm run lighthouse’ to produce the HTML report. If you already have an npm build from a previous step you can of course just unstash the build artifact.
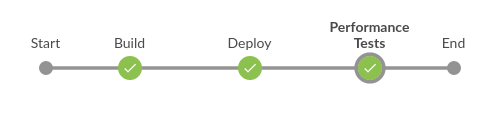
Jenkins pipeline with Lighthouse performance tests stage
Summary
Lighthouse is a valuable and indispensable tool if you want to deliver a fast and user friendly website. Running the analysis on a continuous basis on your CI is a good idea if you take performance seriously. Setting it up is fast and easy. Maybe in the future Lighthouse will also provide a testspec feature that will allow us to fail a CI build (or mark it as unstable) on performance regressions. Though, if you run WebPageTest or Google Page Speed Insights additionally, this is not really needed.